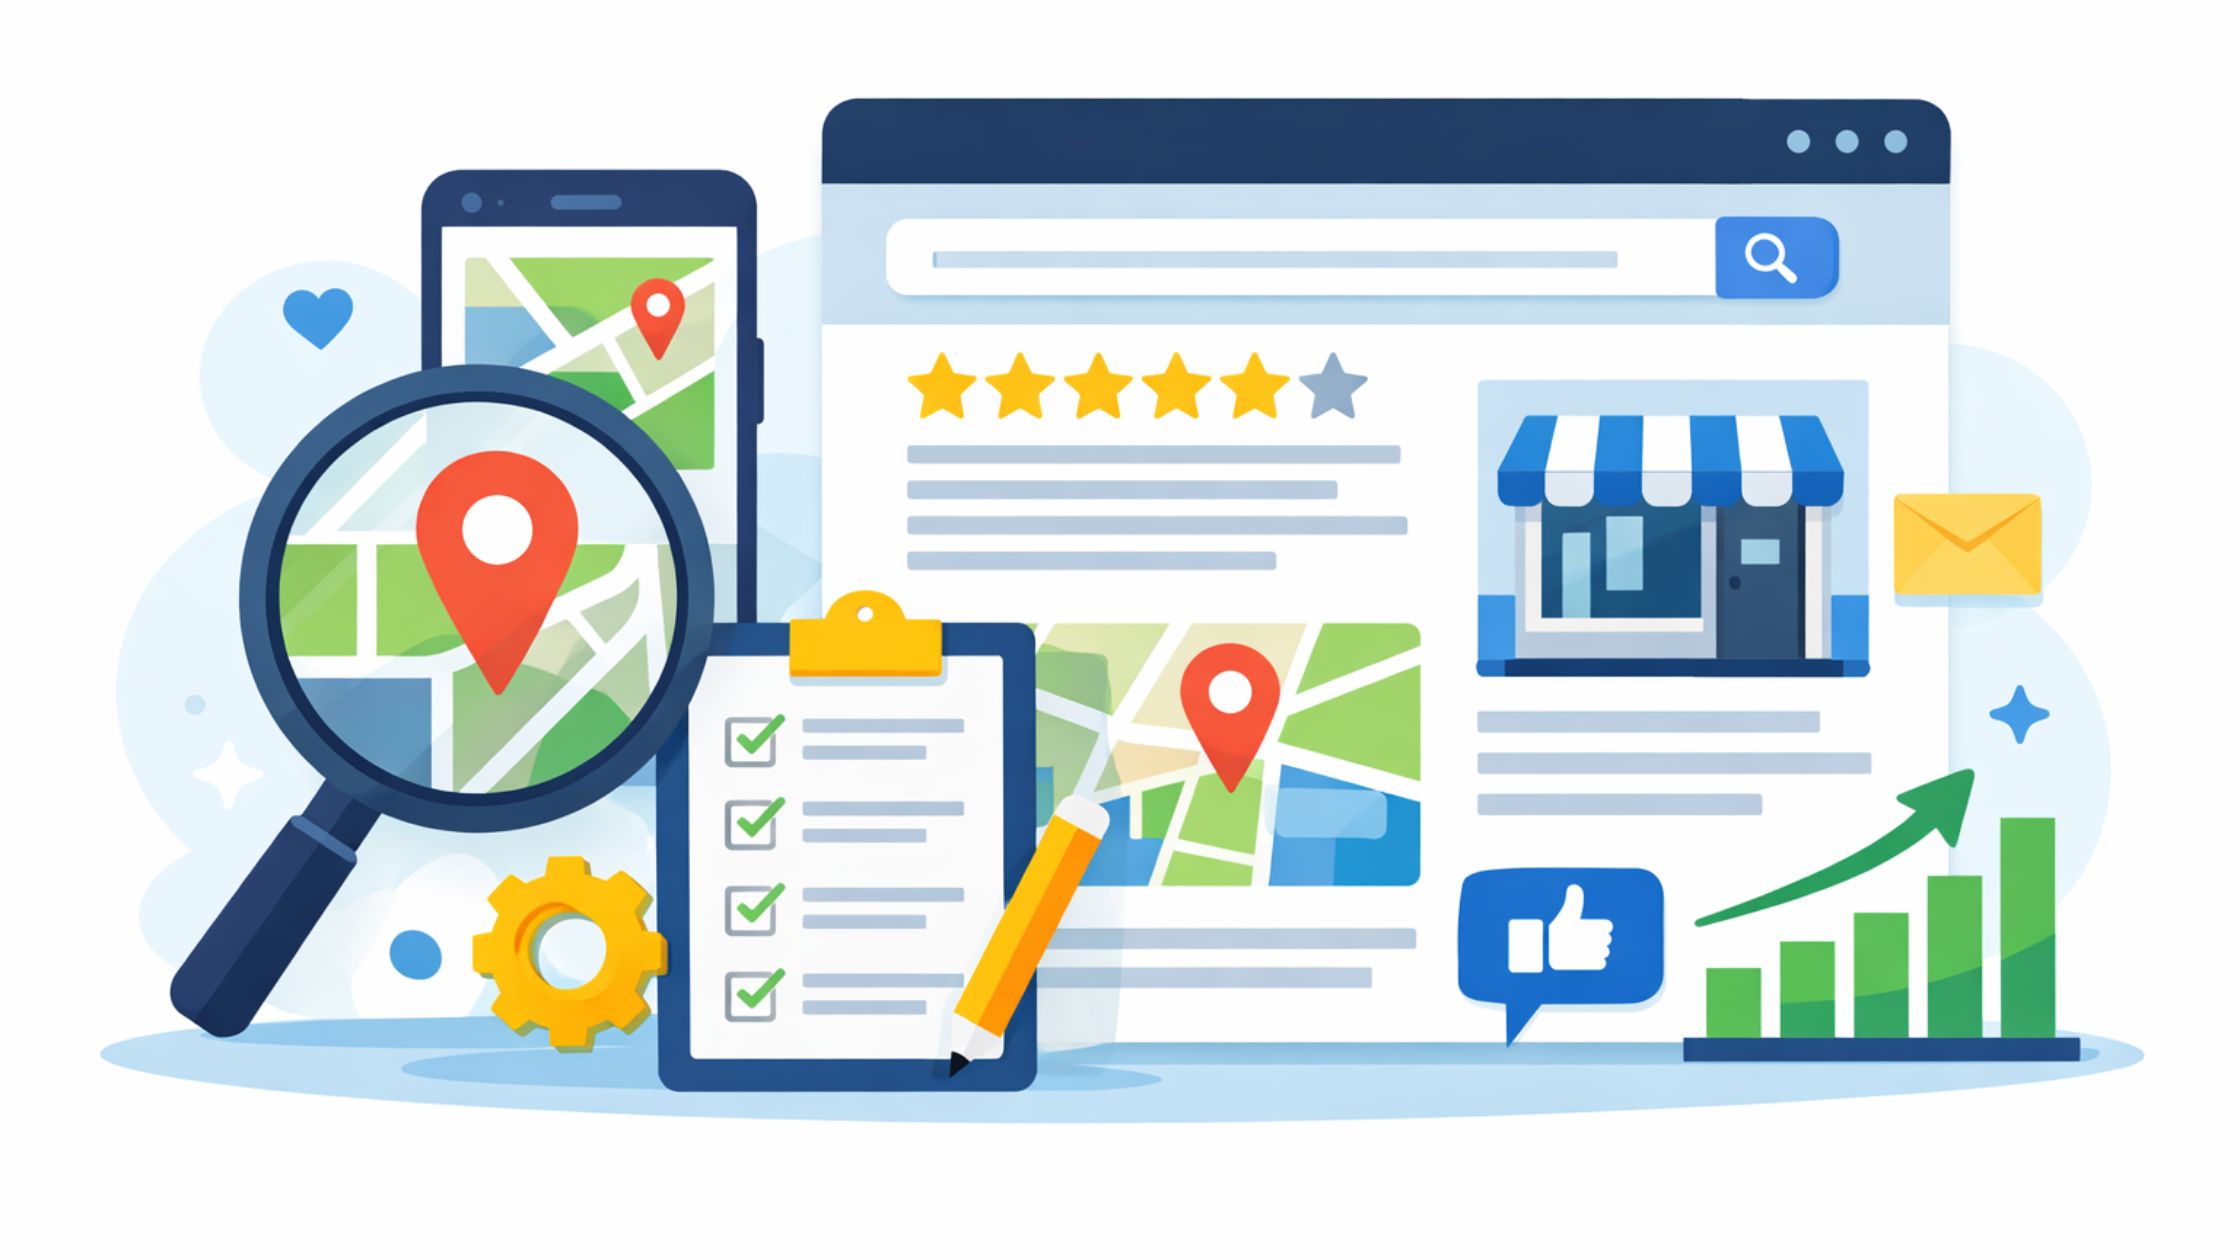
Tracking Google Maps rankings involves monitoring your business’s visibility in local search results.
It shows if your business appears when local customers search for the products or services you offer.
And if it doesn’t? Those customers quietly click on a competitor instead.
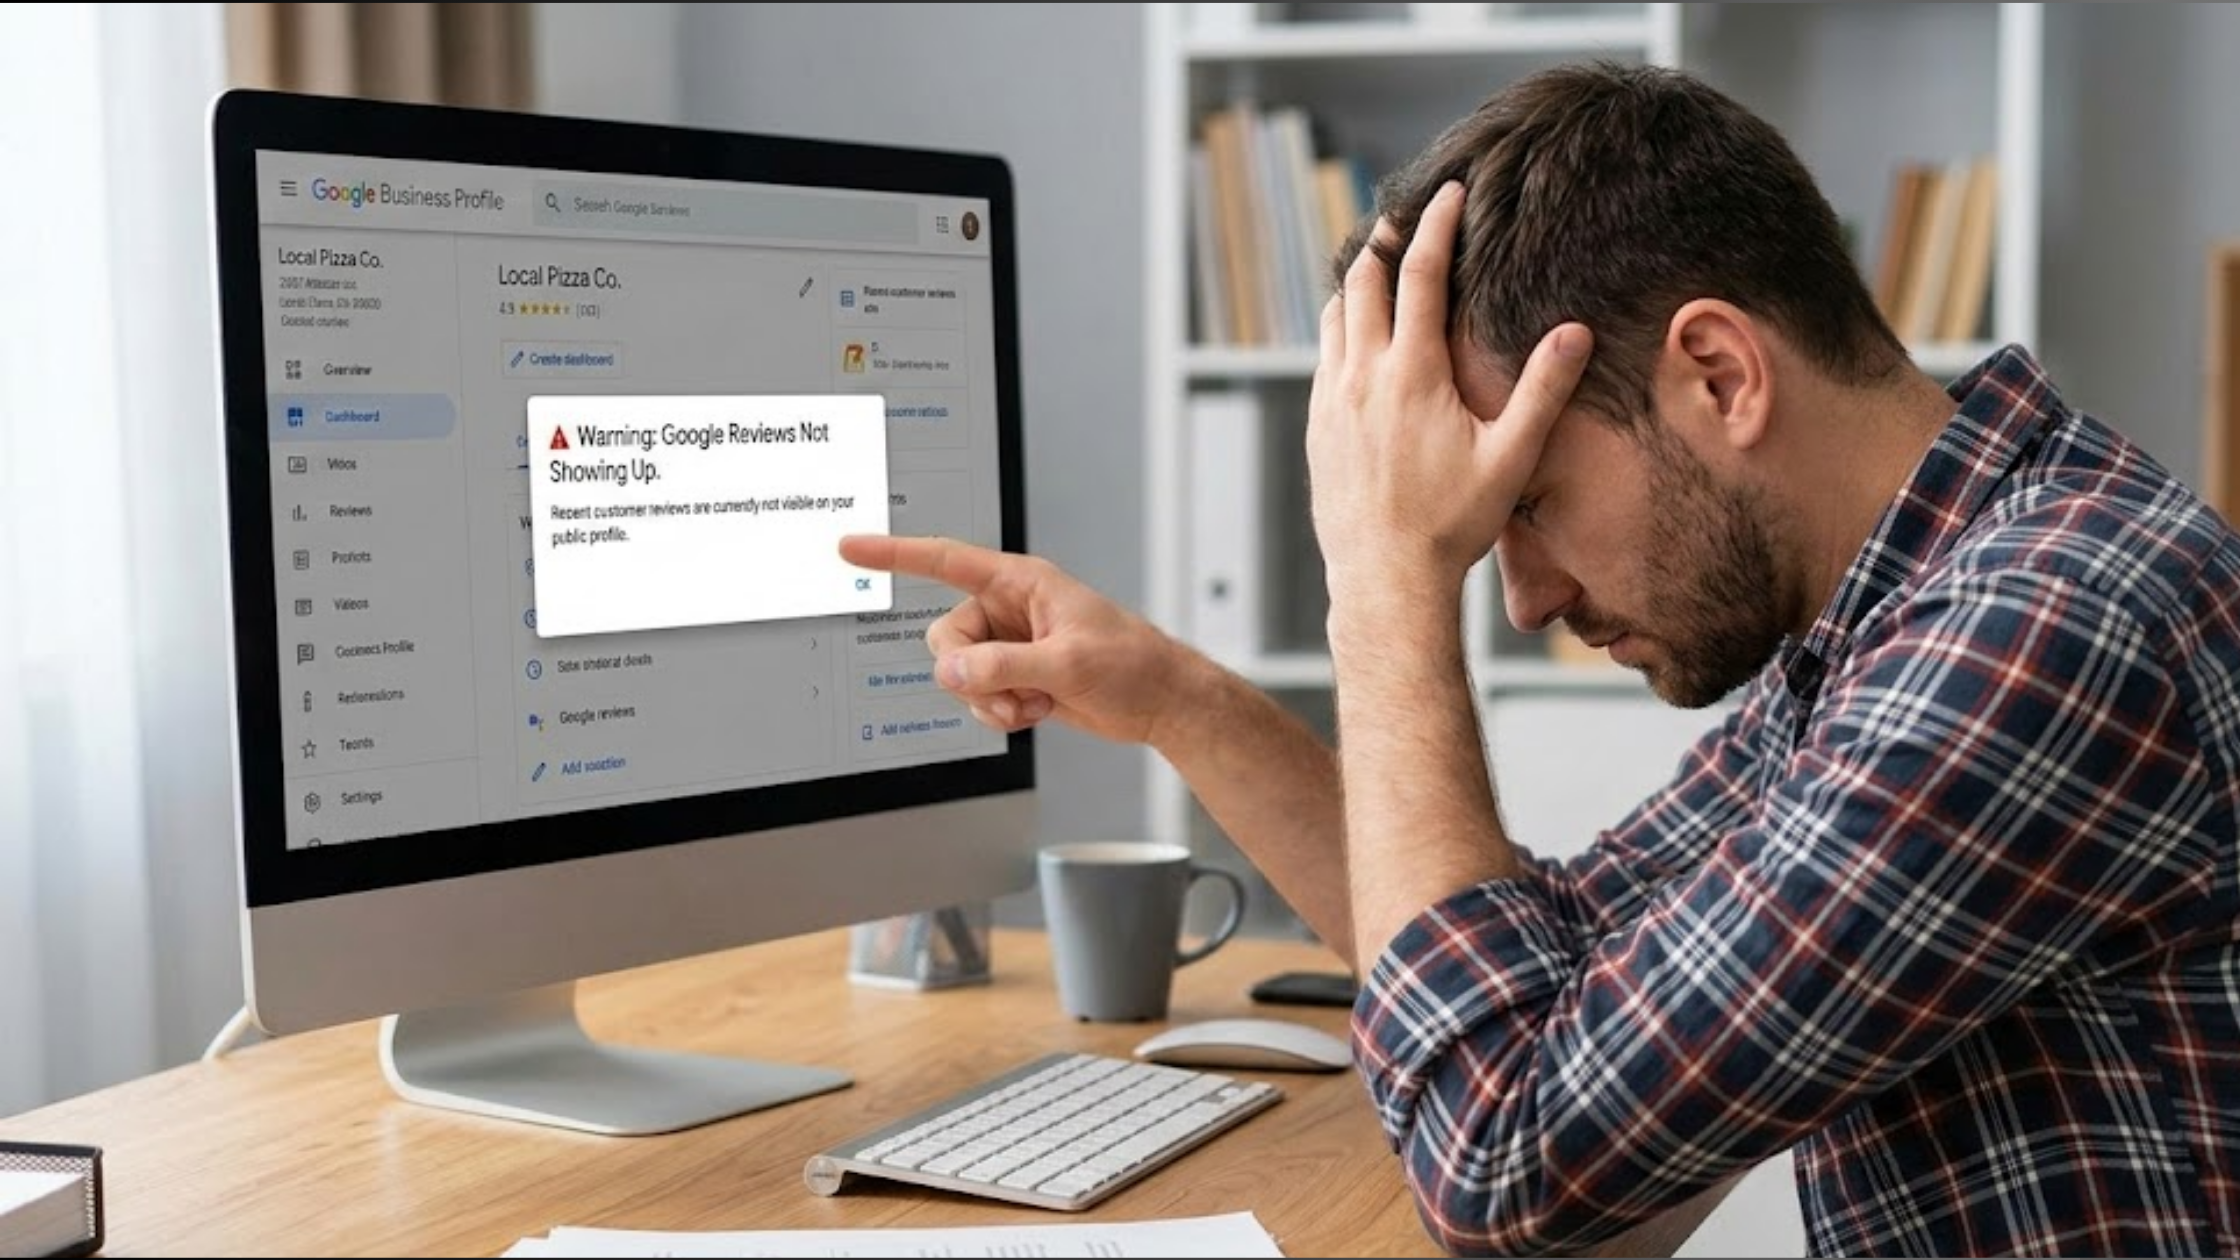
Many business owners assume that just being listed on Google Maps is enough.
You can have a fully filled-out profile, great photos, and solid reviews, yet still rank so low that no one ever sees you.
Tracking your rankings gives you the full picture: where your business shows up, how often it appears, and which areas actually see it.
Without this insight, improving your visibility becomes guesswork. With tracking, every decision comes from real data.
In this guide, you’ll learn:
- Step-by-step methods on how to track Google Maps rankings
- Tools that show your performance across different locations
- Free manual ways to monitor your rankings
- How to interpret the data and take action
By the end, you’ll know not just where your business ranks, but exactly how to improve its visibility and attract more local customers.
Step 1: Start With Visibility Using Olitt Localforce
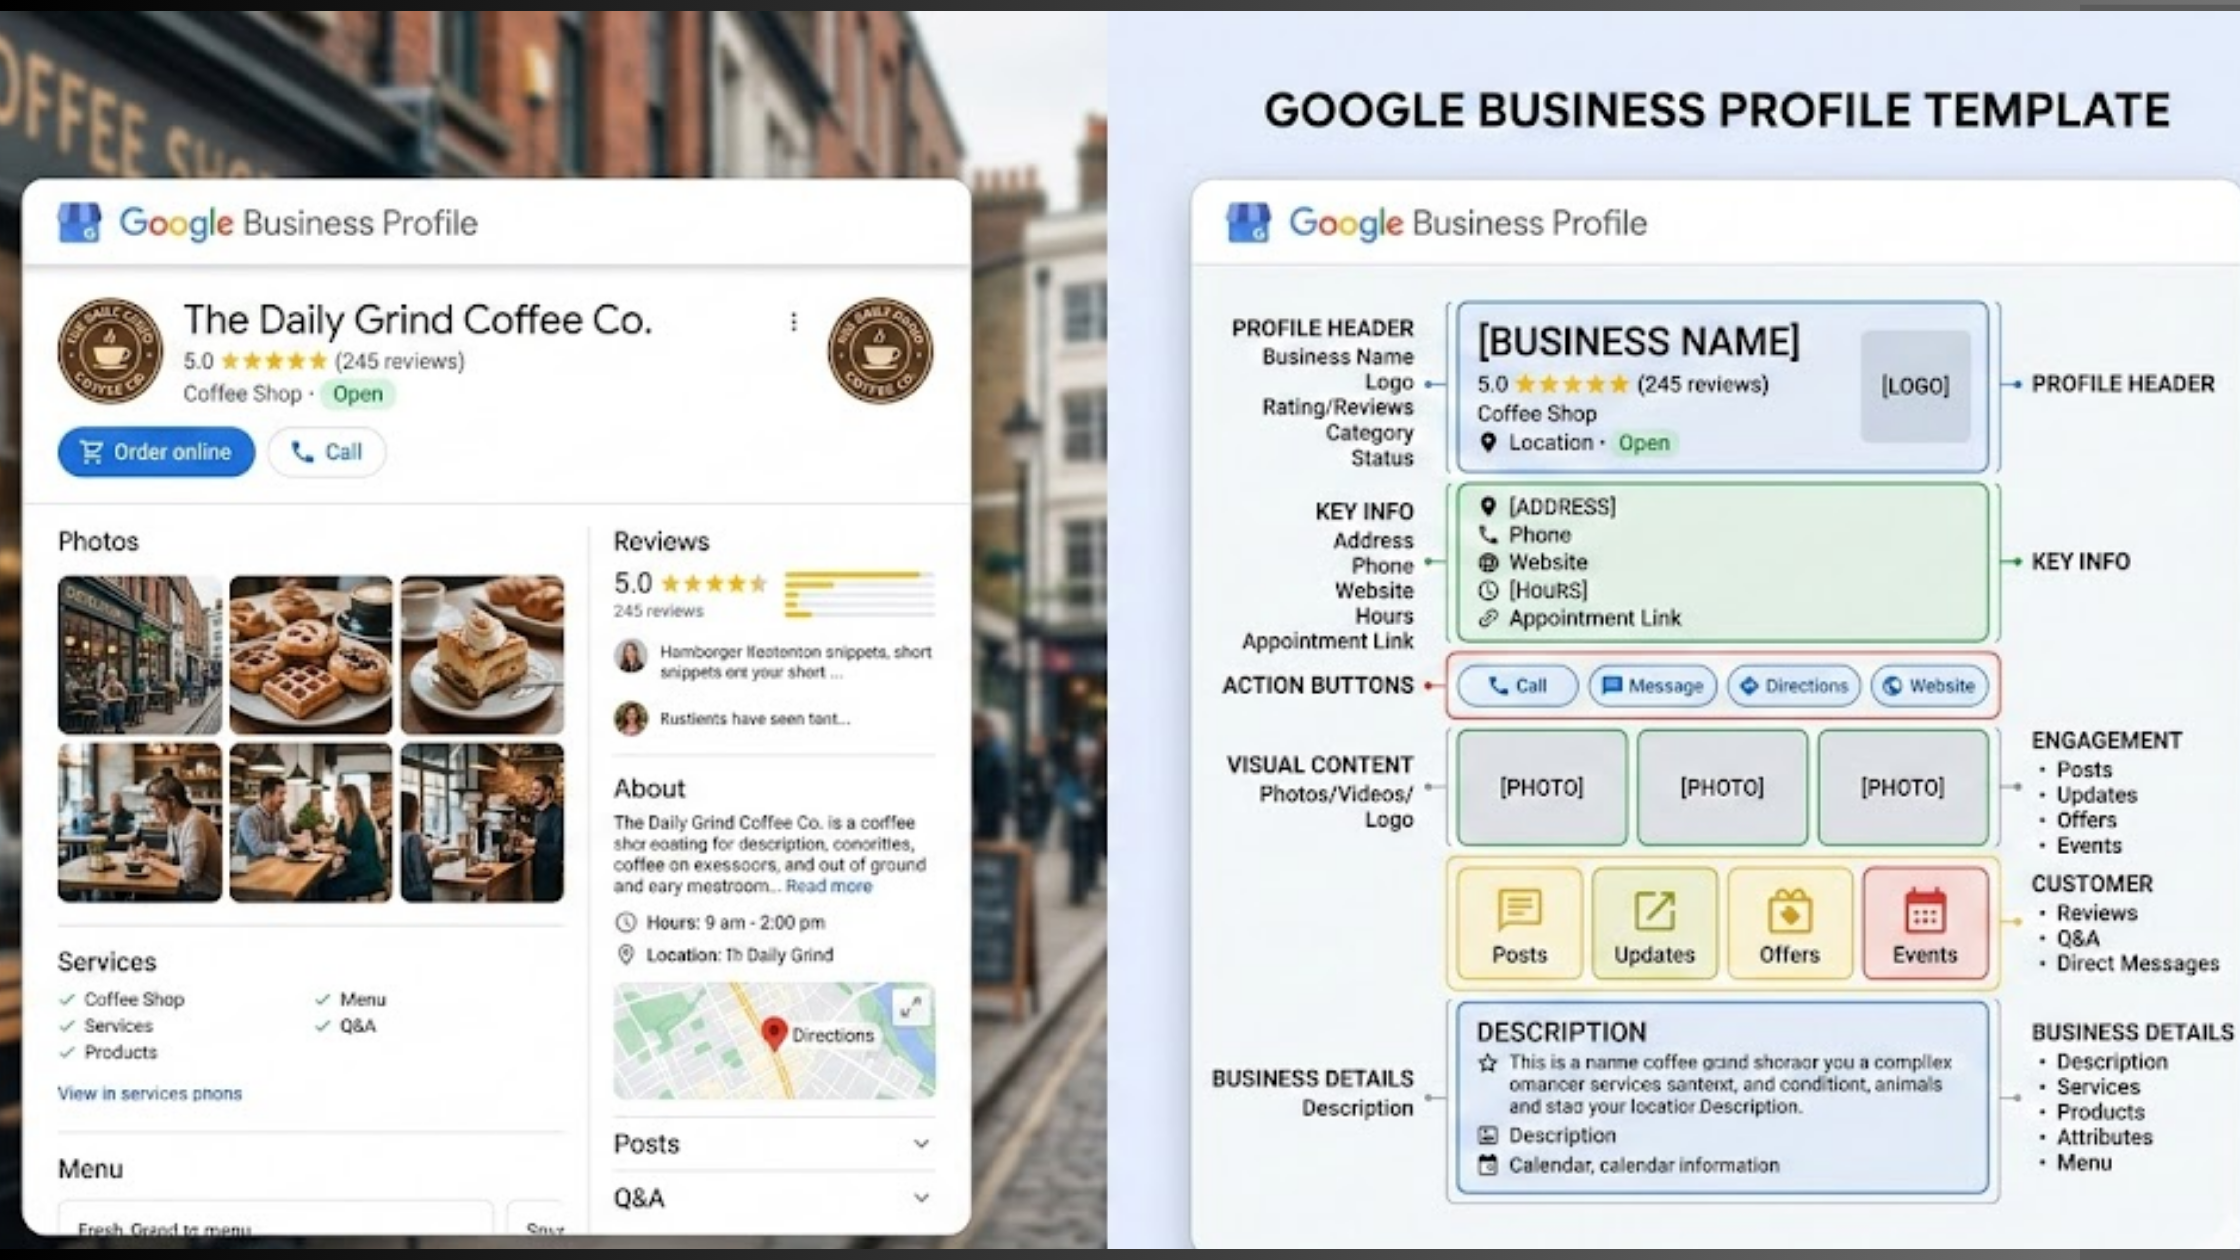
Before jumping into grids, heatmaps, and spreadsheets, there’s one thing you need to be clear about first: your Google Business Profile has to be active, accurate, and well-managed.
Tracking Google Maps rankings without this foundation is like checking your speed when the car engine isn’t fully on.
This is where Olitt Localforce fits into the picture.
While it’s not a traditional geo-grid rank tracker, it works as a GBP performance and visibility tracker, the part that directly influences how well you rank on Google Maps in the first place.
What Olitt Localforce Helps You Track
Instead of showing raw position numbers, Localforce focuses on the signals Google actually pays attention to:
- Profile views and discovery activity
- Calls, direction requests, and website clicks
- Review growth and response activity
- Post consistency and engagement
These signals tell you how visible your business is and how users interact with it. When these numbers move up, rankings usually follow.
Why This Step Comes First
Google Maps rankings respond to activity, trust, and accuracy. Localforce helps you stay on top of all three:
- Your business information stays consistent
- Posts and updates stay fresh
- Reviews don’t sit unanswered
- Engagement trends become easy to spot
Skipping this step often leads to confusing rank drops later. Strong GBP management keeps your tracking data stable and meaningful.
How to Use Localforce Before Rank Tracking
Here’s a simple workflow:
- Check engagement trends weekly
- Monitor calls, clicks, and directions
- Keep posts scheduled and active
- Respond to new reviews quickly
Once these basics stay consistent, your ranking data from grid trackers becomes far more reliable.
Step 2: Track Google Maps Performance Using Olitt Localforce
Once your Google Business Profile stays active and consistent, the next step is tracking how that activity translates into visibility.
This is where many businesses jump straight to rank numbers, but that approach often skips the signals that move rankings in the first place.
Olitt Localforce helps you track Google Maps performance from the inside out.
Instead of showing a single position number, it focuses on what Google measures before rankings improve: engagement, interaction, and profile health.
What You’re Really Tracking With Localforce
Google Maps rankings rise when users interact with your listing. Localforce makes those interactions easy to monitor:
- How often your business appears in local searches
- Calls coming directly from your GBP
- Direction requests from nearby users
- Website clicks from Maps
- Review activity and response speed
These metrics show how visible your business actually is, not just where it ranks on a single screen.
When these numbers grow steadily, it usually signals that your Google Maps rankings are moving in the right direction.
Why Use This Tracking Method
Rank positions change based on the searcher’s location. Two people standing a few streets apart can see different results.
That’s why relying only on “I rank #3” data often creates confusion.
Localforce solves this by tracking real user actions instead of unstable rank snapshots.
Here’s what that gives you:
- Clear visibility trends over time
- Early warning signs before rankings drop
- Proof that your GBP optimizations are working
- Data you can act on immediately
When calls, clicks, and direction requests increase, Google reads that as relevance and trust.
How to Use Localforce for Ongoing Rank Monitoring
Follow this simple routine:
- Review engagement metrics weekly
- Watch for spikes or drops in calls and directions
- Track review growth and response activity
- Keep posts active and consistent
If engagement improves, your Google Maps visibility is improving too—even before grid tools show it.
When to Add Grid Rank Trackers
After Localforce shows steady engagement growth, grid-based tools help you confirm location-based positions.
At that point, the data lines up instead of contradicting itself.
Localforce handles the ranking signals.
Grid trackers confirm the ranking outcome.
That combination gives you clarity instead of noise.
See also: How to Rank Higher on Google Maps in Easy Ways
Step 3: Confirm Google Maps Rankings With Grid & Heatmap Tools
By this point, Olitt Localforce has already shown you something important:
your Google Business Profile is active, users are engaging, and visibility signals are moving.
Now comes the confirmation step.
Grid and heatmap tools answer one specific question, Localforce doesn’t aim to answer directly:
Where exactly does my business rank across different locations?
Why Grid Tracking Comes After Localforce
Google Maps results change block by block. Someone standing near your business can see a different result than someone five streets away.
That’s why a single rank number never tells the full story.
Grid tools solve this by scanning multiple points around your location and showing ranking strength across an area.
Because Localforce already stabilized your GBP activity, the data you see here feels clearer and more reliable.
Popular Grid & Heatmap Tools to Use
These tools work best when used as confirmation tools, not decision-makers on their own:
- Local Falcon – Creates detailed heatmaps showing how your business ranks around your location
- BrightLocal – Search Grid feature visualizes rankings across neighborhoods
- Semrush Map Rank Tracker – Tracks Google Maps visibility with keyword-based heatmaps
- GMB Radar – Flexible, non-fixed grids useful for service-area businesses
Each pin on the grid represents a real search from a specific spot. Green usually means strong visibility. Red means weak or no visibility.
How to Read Grid Data Without Overcomplicating It
Focus on patterns, not perfection.
- Strong rankings near your business = healthy local relevance
- Weak spots farther out = areas needing more authority or engagement
- Sudden drops across the grid = possible competitor activity or GBP changes
Avoid reacting to one bad scan. Grid tools show trends, not guarantees.
How This Connects Back to Olitt Localforce
Here’s where everything clicks together:
- Localforce shows engagement trends
- Grid tools show position distribution
When grid visibility improves after engagement increases in Localforce, the data aligns.
That alignment tells you:
- Your GBP activity is working
- Google trusts your listing more
- Visibility is expanding outward
If grid rankings stall while Localforce engagement grows, it signals the need for:
- More reviews
- Better service categories
- Stronger local relevance signals
Simple Step 3 Workflow
- Run grid scans monthly
- Compare results with Localforce engagement data
- Track expansion, not just top-3 positions
- Adjust GBP activity based on weak areas
Grid tools confirm the outcome.
Localforce explains the reason behind it.
Step 4: Track Google Maps Rankings Manually
Not everyone wants to pay for grid tools right away. That’s fine.
Free tracking methods still give useful signals especially when you already use Olitt Localforce to monitor engagement and profile activity.
This step is about spot-checking visibility, not chasing perfect rank numbers.
Manual tracking works best when you:
- Use it for confirmation
- Track trends over time
- Compare results with engagement data from Localforce
1) Incognito Searches (Quick Visibility Checks)
Incognito mode strips away most personalization from search results. That makes it useful for quick checks.
How to do it:
- Open an Incognito or Private window
- Search your main keyword in Google Maps
- Note if your business appears in the top results
This method shows presence, not precision. Rankings still shift by location, but it helps confirm visibility.

Use this alongside Localforce:
- If Localforce shows rising calls and clicks
- And your business appears more often in Incognito
- Visibility is improving in real terms
2) Spreadsheet Tracking (Simple and Reliable)
Spreadsheets turn random checks into patterns.
Track:
- Keyword searched
- Location used
- Your position
- Date
Over time, patterns appear. One-off drops stop looking scary. Trends become clear.
Pair this with Localforce:
- Log spreadsheet checks weekly
- Compare them with engagement changes
- Growth on both sides confirms progress
3) Location Simulation Tools (Free but Limited)
Some free tools simulate searches from different areas. One popular option is SE Ranking’s Google Location Changer.
It helps you:
- View results from nearby areas
- See how distance affects visibility
- Spot weak zones without grid tools
These tools don’t replace paid trackers, but they help validate what Localforce already signals.
What Manual Tracking Does Not Do
Manual methods won’t:
- Show full neighborhood coverage
- Provide heatmaps
- Replace grid tracking
That’s expected. Their role is confirmation, not analysis.
How Step 4 Fits With Olitt Localforce
Here’s the balance:
- Localforce shows engagement and GBP health
- Manual tracking confirms visibility
- Grid tools validate position spread
When all three point in the same direction, your Google Maps rankings are moving the right way.
Simple Step 4 Routine
- Check Incognito results weekly
- Update your spreadsheet once a week
- Compare results with Localforce engagement data
- Watch for steady movement, not perfection
Consistency beats constant checking.
See also: 7 Best Local Rank Trackers of 2026 (Expert Tips)
Step 5: Focus on the Metrics That Actually Drive Google Maps Rankings
By now, you’re tracking engagement with Olitt Localforce, confirming positions with grid tools, and spot-checking visibility manually.

The next step is knowing which numbers deserve your attention and which ones only create noise.
Not every metric deserves equal focus. Some numbers simply reflect activity. Others show real progress.
1) Map Pack Presence (Top 3 Visibility)
Showing up in the top 3 Google Maps results changes everything. This is where most clicks happen.
Track:
- How often your business appears in the top 3
- Which keywords trigger Map Pack visibility
- Whether visibility expands outward from your location
Grid tools confirm this. Localforce helps explain why it’s happening.
2) Calls, Direction Requests, and Website Clicks
These actions signal intent. Someone clicking ‘Call’ or ‘Directions’ isn’t browsing, they’re ready.
Watch for:
- Steady increases over time
- Drops that align with ranking changes
- Growth after posting updates or replying to reviews
When these numbers rise inside Localforce, Google reads that as relevance and trust.
3) Review Growth and Response Activity
Reviews influence visibility indirectly through credibility and engagement.
Track:
- New reviews per month
- Review velocity, not just star rating
- Response speed and consistency
Listings that stay active tend to gain stronger placement over time.
4) Location-Based Visibility Trends
Rankings shift by distance. Visibility close to your business usually improves first, then spreads outward.
Use:
- Grid tools to spot expansion zones
- Manual checks to confirm presence
- Localforce to connect engagement with growth
This progression shows healthy momentum.
5) Consistency Across Business Information
Small inconsistencies quietly reduce trust.
Check:
- Business name formatting
- Address accuracy
- Phone number consistency
Localforce helps keep this aligned so ranking signals stay clean.
How to Read These Metrics Together
Single numbers don’t tell a full story. Patterns do.
Here’s what alignment looks like:
- Engagement rises in Localforce
- Grid visibility expands
- Manual checks confirm presence
When all three move together, your Google Maps visibility is strengthening.
Simple Step 5 Routine
- Review engagement metrics weekly
- Compare monthly grid scans
- Track review growth consistently
- Look for trends, not spikes
Progress shows up gradually but it shows up clearly.
See also: Google Business Profile Ranking Factors
Step 6: How Often You Should Track Google Maps Rankings
Tracking rankings is important, but overdoing it can cause confusion and stress. The goal is clear, actionable insights, not constant checking.
When using Olitt Localforce, you get a steady view of engagement trends.
Grid tools and manual checks add clarity but only if you check them at the right intervals.
Recommended Tracking Routine
Weekly Checks
- Review Localforce engagement metrics: calls, clicks, directions, and post activity
- Spot any sudden drops or spikes that may need quick action
Monthly Checks
- Run grid or heatmap scans to see how rankings spread across your target area
- Update spreadsheets from manual checks to confirm patterns
- Compare month-over-month changes to spot real trends
Quarterly Reviews
- Take a big-picture look at all metrics together
- Adjust GBP categories, services, or post strategy if progress stalls
- Plan content and updates to strengthen weak areas
Why This Routine Works
- Engagement metrics move gradually; tracking too often creates noise
- Grid tools take time to show results, especially after optimization changes
- Manual checks confirm visibility trends without wasting effort
- Localforce ensures that all activity stays organized and meaningful
Quick Tips to Stay Consistent
- Set reminders to check metrics at the same time each week/month
- Focus on trends, not daily fluctuations
- Align changes in GBP with observed drops or gains
- Keep posts, offers, and reviews active to maintain consistent growth
With this schedule, you’ll have a reliable picture of your Google Maps rankings without obsessing over small, meaningless swings.
Combining Localforce, grid tools, and manual checks gives you a complete view: why you’re ranking, where you’re ranking, and how to improve.
See also: GMB Optimization (How to Rank Google Business Profiles Fast)
Conclusion
By now your question on how to track Google Maps rankings is answered. In summary, this is about understanding how your business appears to local customers and taking steps to improve visibility.
Using Olitt Localforce to manage your Google Business Profile, combined with grid tools and manual checks, gives a full picture of your local search performance.
Focus on key metrics, calls, clicks, directions, reviews, and accurate business info, and track them consistently.
Over time, you’ll see steady growth in visibility and customer reach.
Start using Localforce today to keep your profile active and watch your Google Maps rankings improve.